Infographics

Digital Marketing Infographics

What is ChatGPT? – A Revolutionary AI Model

ChatGPT – The Revolutionary Artificial Intelligence Model Recent years have seen a rise in interest in artificial intelligence, and OpenAI has been at the forefront of this growth with its ground-breaking ChatGPT language model. We’ll examine what makes ChatGPT a ground-breaking language processing technology in this post, as well as its advantages and disadvantages. What […]
Digital Marketing Infographics

The Internet’s Most Hated – [Infogrphic]

Most Hated people on the internet In this world, the area where the internet occupied is countless, each and every corner al people are using. This plays both good and bad, Internet hate thing is present within that which is filled with Racists, white nationalists, etc. The internet’s most hated group of people. according to

SEO Content Marketing Infographics

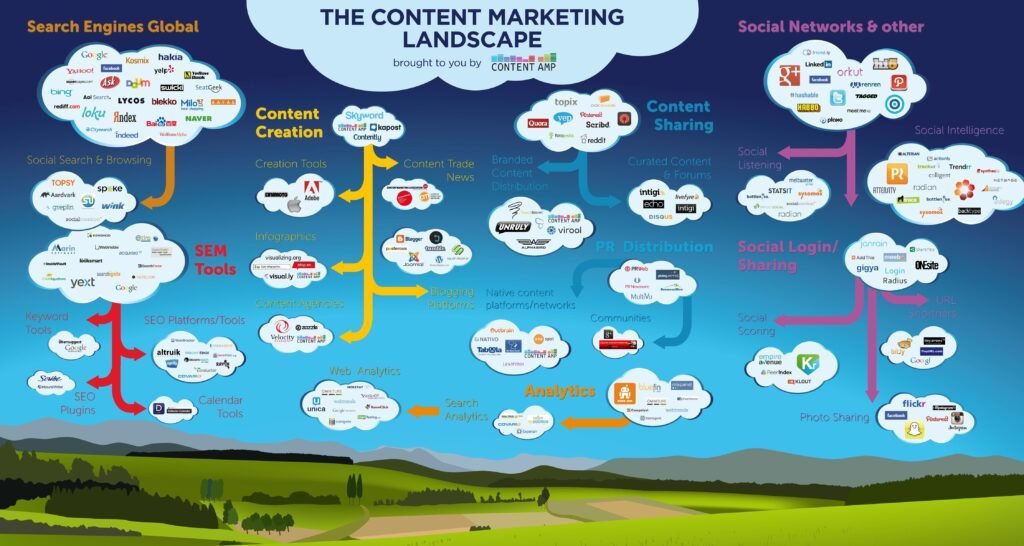
Smart Ways to Combine Content Marketing with SEO This content marketing infographics provides the information about content marketing strategy, where to submit our content, how to optimize and how to choosing the site to market different types of content with SEO strategies. Different types of contents and their marketing are , Social Networking Video Sharing Audio

Know the Factors to improve SEO Rankings of a Website – Infographic

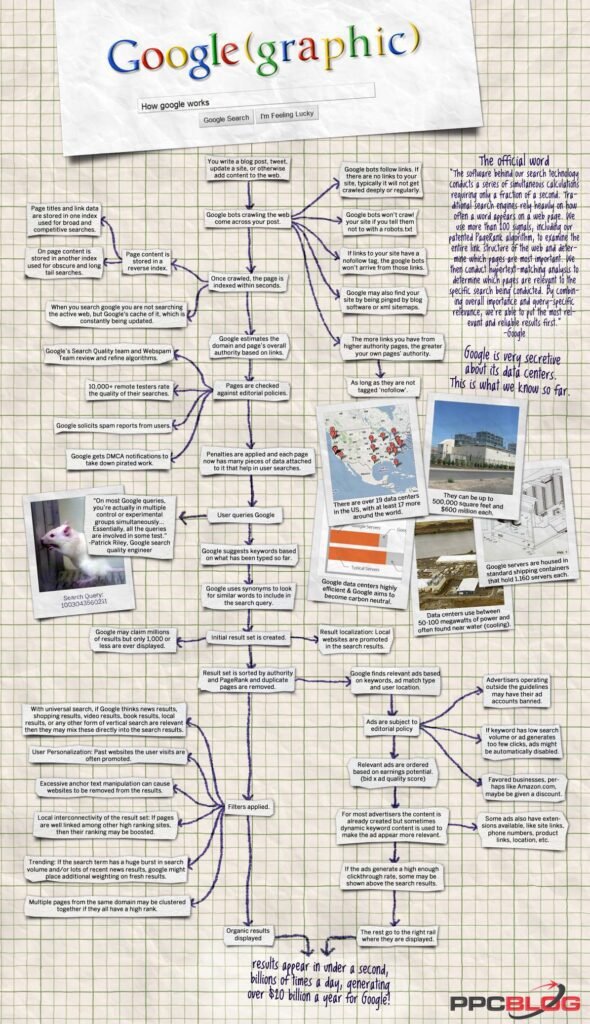
A search engine results page (SERP) is the listing of results returned by a search engine in response to a keyword query. The pages of results that you will see are the SERPs. There are basically three main components of SERP: the actual search query, organic SERP listings, and paid SERP listings. Organic SERP listings are the natural listings generated by search engines based

SEO Activities – Infographic

SEO, which helps search engines find and rank your site higher than the millions of other sites in response to a search query. SEO thus helps you get traffic from search engines organic results. Achieving search engine results requires more strategic execution. To attain the SERP some SEO factors should done. Here the infographic is